1 Week 1: About this course
Objective of this session:
Make you excited about the power and value of data analysis using R
Showcase the variety of things you can do with R
Take away your fear of stats.
Outline the course and requirements
1.1 Why data skills matter?
In 2017, the Economist published a now famous article proclaiming that the world’s most valuable resource is no longer oil, but data. Since its publication, the statement has become a common refrain when people want to highlight the growing importance of data (like me right now).
Data is all around us. In our jobs, in our private life, everywhere. Decisions in many private industries become increasingly more “data-driven.” Governments all over the world have taken up the agenda of “evidence-based policy-making” using data to make better decisions and change lives. The United Nations see the potential of a “data revolution” in international development. The media and “data journalists” overload us with statistics and graphics and cite the newest research on an issue.
More than ever, the burden on the individual to navigate this brave new data world has increased. The problem is that data skills and data literacy have not caught up with the world around us. Humans are not very good at numbers and statistics. Daniel Kahnemann won the Nobel Prize for proving that in 2012. People are not easily convinced by facts. Many see us stumbling into a “post-factual world” and “post-truth politics.” Yet we need citizens around the world to be able to understand data and evidence. The great Hans Rosling called it “Factfulness: Ten Reasons We're Wrong About The World - And Why Things Are Better Than You Think.”
One very practical way to do that is to get your hands dirty and work directly with data. Applying data analysis will help you understand basic concepts and it will sensitize you for different data around you, how it has been produced and used. This is what this course is for.
Now I hope you feel somewhat hyped up about doing this course. I have basically said nothing less than that it will make you a better citizen in today’s society. What better reason is there, right?
Well, there are at least two more practical reasons. First, data skills will likely also help you to get a job after university. Not only in business, but also in the public sector (education, health care etc.), non-profit sector, and media. Even if you don’t want to work directly with data, it will still be a valuable skill to have as the probability of having colleagues that work with data is very high. Second, if you are an undergraduate or graduate student at university, you will probably have to write a lot more course papers. Handling data by yourself will open up new ideas for your own research and help you understand the studies you are citing, many of which will be using data.
1.3 Why R?
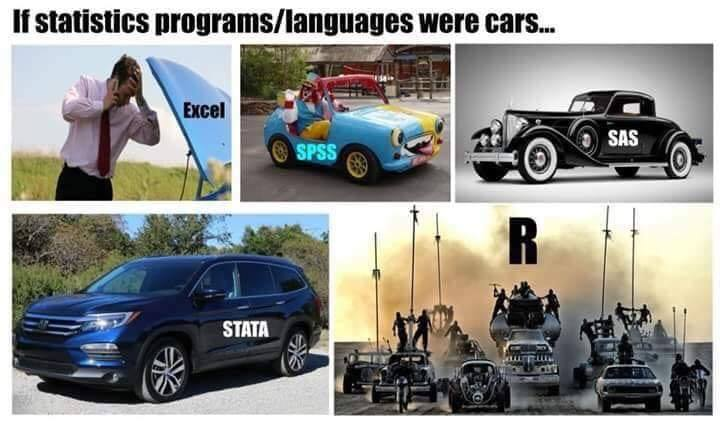
I asked myself this question several times in the past. When I started my PhD, I had to choose to focus on one statistical package to use for most of my research. Stata was the dominant language at my university, but some folks used R and I had a hard time choosing. In the end, I went for Stata. And I don’t regret it. Stata introduced me to many concepts that are also useful in other programming languages. It also is a little easier to learn than R, and most academic researchers in my field were using Stata.
A couple years ago I thought about “why R” again. By then, however, more people used it across different industries, and I had left academia to work for the United Nations.
One key advantage that R has is that it is free. Universities mostly buy licenses for other packages, so costs don’t matter for researchers and students but for companies and organizations, costs matter. Another advantage is that R is more flexible than other common statistical programming (stats) languages like Stata or SPSS. You can produce different types of documents, be more flexible with graphics, import and manipulate more types of data, create and design websites, blogs, interactive visuals, automatically pull text data from the web (i.e. web scraping) and much more.
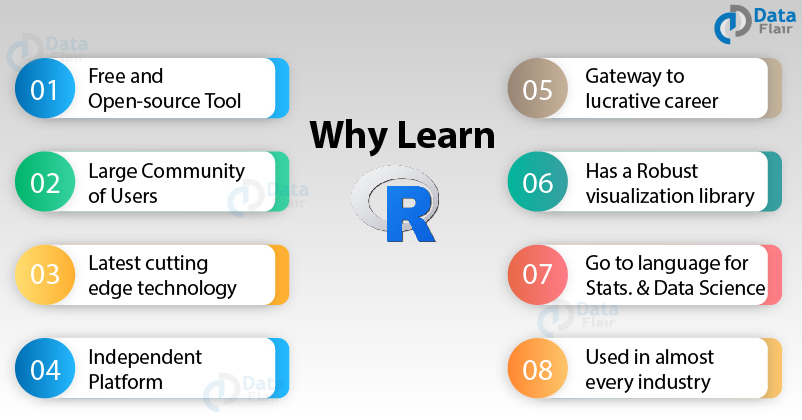
Since R has a huge community around the world, it is quickly developing and if there is a new problem to solve, it won’t take long until someone figured it out and provides the solution for everyone. If you have a quick question, there are many fora online where people explain how it is done. There might not be not a single R user that has never used stackoverflow; a forum which you will eventually also come to treasure and worship.
The Figure below summarizes some of the benefits of learning R.
1.4 Why “intro?”
By “intro” I mean that I will cover the basics. There are usually the following 6 steps in any data analysis project:
Finding data
Importing data into R (i.e. “reading,” “loading”)
Cleaning, restructuring and combining data (i.e. “data wrangling,” “data management”)
Descriptive data analysis (tables & charts)
(Statistical) modelling
Communicating your results
In this course, I will cover all steps except 5. There will be no statistical modelling in this class, so we won’t cover things such as hypothesis testing, regression analysis, machine learning, predictions, forecasts etc.
The good news is that step 5 also requires the remaining steps which you will learn here. So if you are interested in learning more, it will be easy to move on to more. Throughout the course I will link resources that will allow you to dig deeper. But before you run fancy statistical models (which will require a lot more background in statistics and econometrics), you must learn the basics.
When people call themselves “data scientists,” we usually imagine them doing some incredibly complex data wizardry in basements filled with servers. Sometimes that is true. But in 80% of the cases, data scientists are first occupied with getting the data into a shape where they can finally start analyzing it. And then they spend more time understanding what type of data they are dealing with by using descriptive statistics.
In fact, forget everything you’ve heard about data science and consider the following figure as the ultimate truth (to be taken with a grain of salt).
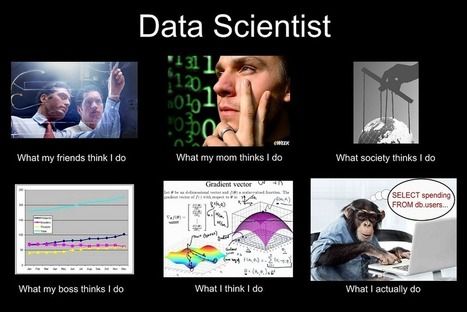
I will talk more about what “descriptive statistics” is in later sessions. But in a nutshell, it is about “describing” what we see in the data, uncovering patterns and comparing results for different groups. We are not interested – at this stage – in the nature of the relationship between different information in the data.
1.5 What you need
There are 4 things you will definitely need:
A computer, internet connection, 4 GB Ram, English language comprehension
Curiosity: Did you ever come across a question in your studies or in your daily life where you thought it could be really interesting to do research on? At the same time, you thought: “I am not really good with numbers, let other people do it.” Then this course can still be a good fit for you. You will need some curiosity about data, data analysis and what you can do with R. I tried inciting some of that curiosity above. I will keep things easy, but you will need some curiosity to push you through some of the challenges.
Patience: R can be a steep learning curve, especially if you are not familiar with any statistical software or programming. I will keep things very simple, but you have to be patient. You will want to throw your keyboard out of the window many times during this course, because some line of code will always give you an error message. I have been through this. We all have. It will become a lot easier after a while. Be patient.
Learn by trial and error: This course is very much focused on application. You will learn concepts through applying them. Don’t be afraid to try out things. Your computer will not explode when you type in the wrong thing.
Being able to google things on your own: Whatever question or problem you will have, there is a 99% chance that somebody else has had that same problem. Just google it and you will find the answer online. If you still can’t find a solution, ask around. If they don’t know it either, they will probably google it as well.
Advantageous, but not required:
A project idea or dataset that you would like to analyze
Basic stats knowledge
Basic Excel or Stata/ SPSS
1.6 Structure of the class
The course is structured into weeks. Each week has the following structure:
Explain objectives of the week
Introduce topic and motivation, and provide background
Application in R (using one dataset throughout)
Exercises in class (using the same dataset)
Exercises at home (using your own dataset)
Providing additional learning resources
The datasets used throughout the course can be found here.
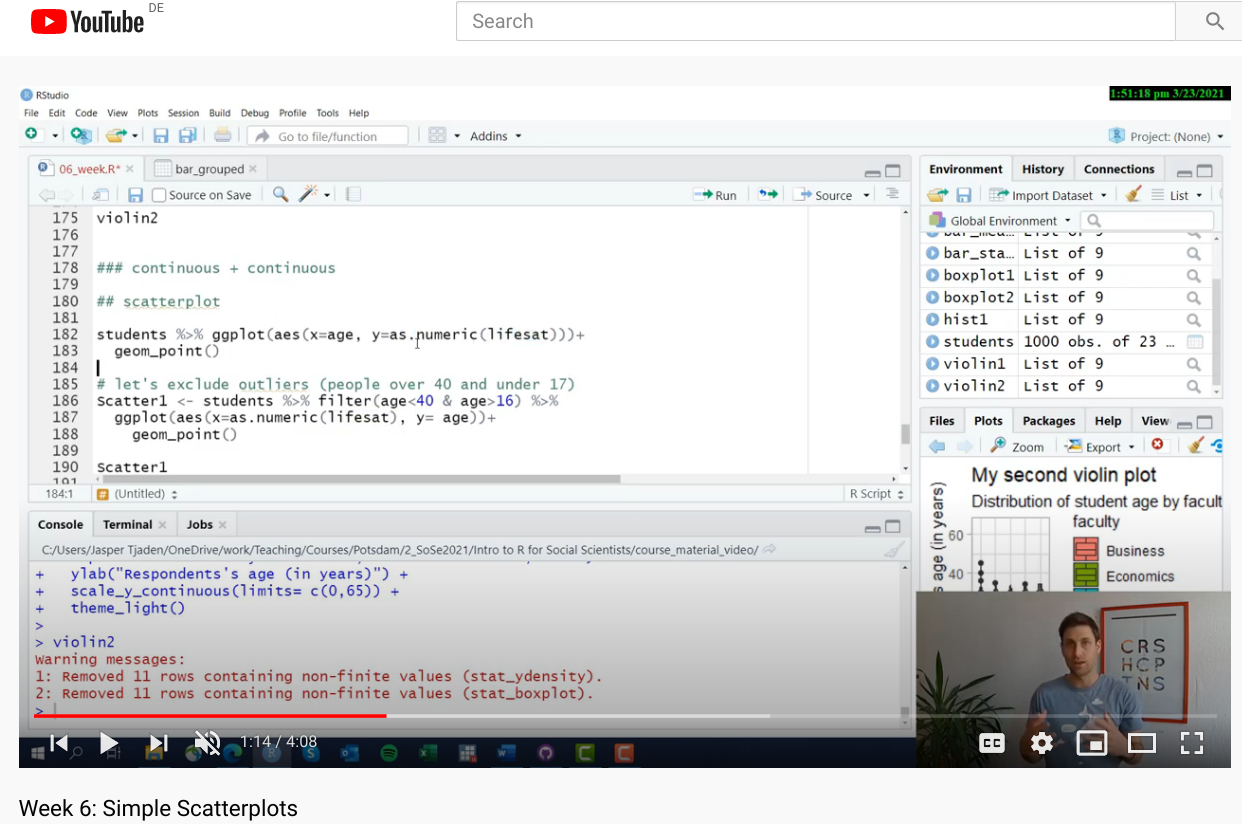
For each week, I recorded a video running through the application in R. This will allow students to self-study at their own pace. Please click here to watch me walk through each lesson.
1.7 Who am I?
My own research focusses on migration and migrant integration issues. I work with different types of data. Sometimes survey data, at times administrative or digital data. Depends. I am interested in real-life problems. That is why my chair at the university is called “Applied Social Research and Public Policy.” One reason I wanted to prepare this course is because I thought it makes getting started in R much easier and dispels some fear of doing data analysis yourself. I started off with Stata and transitioned to R in 2019, so I am still very much a learner myself.
1.8 Acknowledgements
I would like to thank Lina Jeannot and Ba Linh Le – two research assistants in my team who have supported me in putting this course together and making it available online.
1.9 Exercises
Group poll:
Which program are you enrolled in?
Is this your first experience with stats/data?
Let’s break out into groups. Please discuss with your group members:
Briefly introduce yourself to the group
Why were you interested in this class?
Do you have any prior knowledge/ experience with data analysis?
What do you want to get out of this course?
When we reassemble in the big group, I will randomly select students to summarize the discussion.